


The financial decisions are no longer based only on emotional or static reports on Excel. Businesses today are strong to the solution and analyze data and smart — which, Financial Dashboard (FD - financial dashboard) are becoming indispensable tools in the system of financial management-modern. If you are a business looking out or in the process of implementing the solution analysis, financial statements, this article will help you:
- Understand FD what is
- Know the business should monitor the financial indicators which
- Choosing a solution dashboard financial efficiency, is worth the investment
Let's explore the details to see why FD is helping thousands of business decisions faster, optimize cash flow better.
1. Financial Dashboard is what?
Definition Financial Dashboard
Financial Dashboard is a tool to visualize financial data for the business management track, analyze and evaluate financial performance of the organization in real time. Instead of reading the reports of long lines in text or Excel spreadsheet, you can see the important indicators such as revenue, profit, expenses, cash flow, debts and... as a chart, control panel, indicator color.
Difference with financial reporting traditional
| Criteria | Financial statements tradition | Financial Dashboard |
| Display format | Tables, figures, text | Chart, visual indicator, realtime |
| Updated | Periodic (month-end, quarter) | Real-time (real-time) |
| The ability to analyze | Often have to manipulate craft | Can drill-down, filter flexible data |
| Matching | Staff accounting, auditing | CEO, CFO, managers |
Why business switched to Financial Dashboard?
- Speed decision: Instead of take a few days to have a report from the finance department, the CEO/CFO can read the data immediately.
- Higher accuracy: Reduce the risk of errors when entering data manually as in Excel.
- Comprehensive vision: lets look is the financial picture overall, the link between revenue, costs, debts, cash flow...
- The ability to react flexibly: When you see an indicator exceeds the threshold (as the cost of an abnormal increase), the administrator can handle right now.
Classify the form of Financial Dashboard often used
Don't have a template Financial Dashboard that suit all business. Depending on the user role, reporting needs, or pattern of organization where the form dashboard will be built different. Here are the most common classification help businesses choose the right form of dashboard need to implement:
Classified by users
| Role | Dashboard match is displayed |
| CEO/Founder | Overview cash flow, profitability, revenue, growth |
| CFO/chief accountant | Public debt, cash flow analysis, KPI, financial forecast, financial |
| Head of department | Cost of room, board, KPI internal budget is granted, effective operation |
Effect: Helps each level management focus on just the data I need without getting tangled.
Classified according to the type of financial data
- Dashboard sales: track sales results, the average value of orders, conversion rate.
- Dashboard cash flow: track the amount of money in/out, warning, pussy, fund cash flow projections.
- Dashboard cost: expense tracking, hr, marketing, operations, R&D...
- Dashboard investment performance: ROA, ROE, ROI under each investment or parts.
Effect: group assignment financial data, thematic helping businesses deepen analyze each array more efficiently.
Classified according to duration track
- Dashboard by day: Fits business, ecommerce, retail.
- Dashboard by week/month/quarter: the most Common, fits almost any business.
- Dashboard compare states: comparison YoY, MoM, to analyze trends.
Effect: Helps to track financial volatility, and give early warning to the business.
Read more:
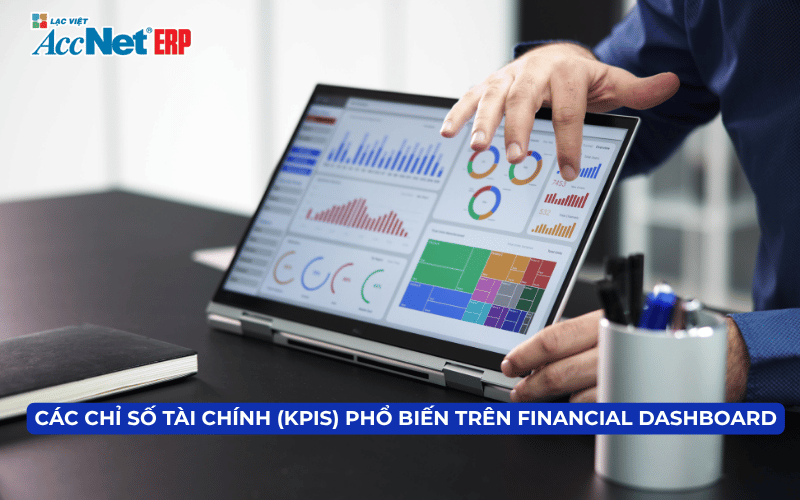
2. Financial indicators (KPIs) common on the Financial Dashboard
A Financial Dashboard is only truly effective when it is the financial indicators (KPIs) strategic – reflect true health business support managers make decisions timely and accurate. However, not business always choose the right, understand the deep meaning of the KPI this. Here are 6 group financial indicators downloads, accompanying analysis role, formula, meaning, how to read, help business effective application on dashboard of your finances.
Sales (Revenue)
Revenue over time:
- Daily revenue, monthly, quarterly, annually.
- Compare according to each states (YoY, MoM, QoQ).
Revenue by channel/type:
- Under each product/service.
- By branch, region, sales channel.
Indicators related: The rate of growth of revenue = (revenue-this - before) / before x 100%
Application: Tracking revenue detail by time, channel helps managers:
- Get to know sales trends
- Detect strong points/weak according to each channel
- Forecast cash flow, build a growth target of police more realistic
Profit (Profit)
Gross profit (Gross Profit)
- = Net sales – cost of goods sold (COGS)
- Said the ability to control input costs
Net profit (Net Profit)
- = Revenue – All costs (including tax)
- Reflect the real results of business activities
Profit margin (Profit Margin)
- Gross profit margin = gross profit / revenue x 100%
- Margin net profit = net profit / revenue x 100%
Application: Profitability index allows business:
- Compare the operational efficiency over time
- Control cost-effective
- To assess the potential profitability each product line
Cash flow (Cash Flow)
- Total cash flow real fall – food expenditure (Operating Cash Flow): Reflects the real money business, retractable, spend
- Forecast future cash flows: Based on orders, liabilities, costs have expected
- Fund balances cash, end of period (Ending Cash Balance): Is the amount of cash/revenue actually have to spend
Application:
- Avoid liquidity crisis
- Plan the exact cost
- A decision to invest/spend/additional capital logical
For example, warnings are often seen on the dashboard:
- Forecast pussy funds after 15 days
- A sharp increase cost unusual seasonal
Read more:
Receivables and payables (Receivables & Payables)
Receivables (Accounts Receivable)
- The total value of invoices the customer has not paid
- Status public debt by date/overdue
Accounts payable (Accounts Payable)
- Total bill business debt provider
- Days to maturity, ability to pay
Only the number of revolutions public debt:
- DSO (Days Sales Outstanding) = (receivables / Sales) x number of days of the reporting period
- DPO (Days Payables Outstanding) = (accounts payable / cogs) x number of days of the reporting period
Application:
- Optimize cash flow and avoid misappropriation of funds
- Planning the proper payment term
- Risk warning: bad debt or liquidity pressure abnormal
Inventory (Inventory)
The total value of inventory: Classified by type of goods, time inventory value
Inventory turnover
- = Cost of goods sold / inventory value average
- To know the level of consumption of goods
The rate of inventory long day
- The proportion of the row already exists > 60/90/120 days
- It is easy to cause bury capital, risk reduction value
Application:
- Inventory alert for slow-moving
- Planning import of logical
- Cost optimization, storage, cash flow
Financial ratio general
Debt-to-Equity (Debt / Equity): Expression levels depend on the loan debt
ROI, ROA, ROE
- ROI (Return on Investment) = net profit / Total investment
- ROA (Return on Assets) = net profit / Total assets
- ROE (Return on Equity) = net profit / Equity
Application:
- Reviews the capital
- Compare business performance over time
- Is base investment decisions – capital funding – dividend
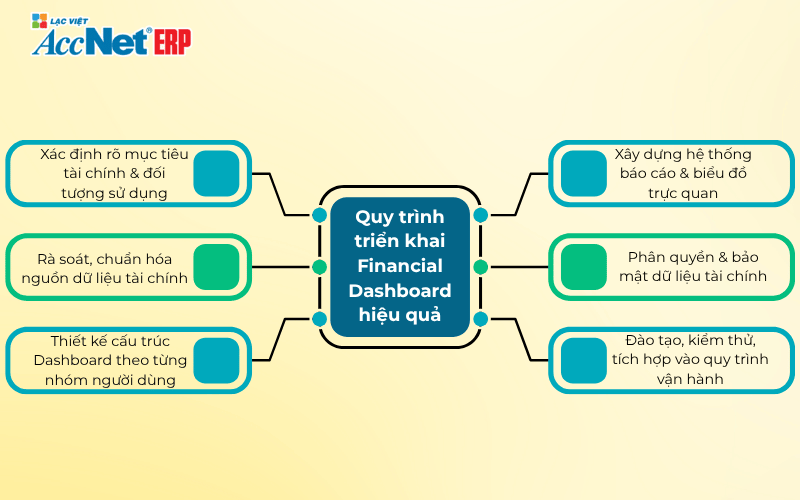
3. Deployment process Financial Dashboard effectively
Build Financial Dashboard not only is the collection database and then displayed in the chart. If the business lacks deployment process right, the dashboard will become untidy, misaligned goals or being “mothballed”. Here are 6 steps for effective implementation help businesses make FD into practice – measure right, right look, the right decision.
Step 1: clearly Define your financial goals & object using
Thinking wrong common: Many businesses start from “to report have beautiful chart” instead of from the question “do I need to control what?”.
Implementation guide:
- Determine where is the problem financial business are met (for example: cash flow is not stable, the cost increase, do not capture the performance of sales)
- Listed user group the need to use the dashboard: CEO, CFO, chief accountant, Head of business department Production...
- With each object, determine what metrics they need to track daily / weekly / monthly
Outputs of this step:
- List of financial goals specific
- List user group + KPI needed for each group
Learn more:
Step 2: Review, standardization, data sources, finance
A dashboard is only as good the quality of data it takes in. If the data is missing – wrong – sperm – skewed logic, the graphs are pretty much well... wrong nature.
Implementation guide:
- Check out the source of existing data: accounting software, Excel, general, ERP, inventory system, sales...
- Clarification: the data are updated often? There are overlaps between the departments not? Units of measurement are unified not?
- Standardized input data:
- Put rules to enter accounting data, grouping code, code, cheap, cost code...
- Data cleansing, inventory, liabilities, costs
Outputs of this step:
- List of data sources reliable
- Base input data have been standardized, ready to connect
Step 3: structural design Dashboard according to each user group
The biggest mistake is to create a Financial Dashboard for the whole company. This makes each person must filter – select – ne no data related to himself.
Implementation guide:
- Build dashboard by role:
- CEO: focus, cash flow, revenue, gross profit
- Chief accountant: a detailed public debt, cash flow, cost
- Sales: revenue by customer, channel, product
- Each dashboard should only contain a maximum of 6-10 main index
- Display preference over time (timeline), trends, warning threshold
Outputs of this step:
- The interface design, dashboard fit each user group
- Minimalistic interface, easy to see, easy to manipulate
Step 4: build your system, reports & dashboards, visually
This step is technical but also strategic decision effectiveness when Financial Dashboard go into operation.
Implementation guide:
- Select the type of chart to suit each data type:
- Cash flow → column chart combined line
- Cost → pie chart or column
- Inventory → heatmap over time
- Construction features drill-down (away from overview → details): For example, Click on the “revenue months 5” → Show details according to customer → details of each invoice
- Filter settings: time, product, affiliates, employees
Note: to Avoid abuse, too many chart – let the dashboard to tell a story clearly financial.
Outputs of this step:
- The chart right type of transmission, remove information
- Dashboard has the ability to filter – drill-down flexibility
Step 5: authorization & security financial data
Finance is sensitive data – if the dashboard is not authorized tight, the risk of leakage, misleading or manipulated is very high.
Implementation guide:
- Set decentralize the role:
- Staff only see the report departments themselves
- Middle managers see the dashboard team in charge
- CEO/CFO overall view, have the right to drill-down comprehensive
- Apply the principles of data security: encryption, IP control access, hosted stain manipulation
Outputs of this step:
- Financial Dashboard for safe operation, the right people – the right
- Minimize the risk of leakage or edit external data control
Step 6: Training, testing, integrated into operational processes
This step is to decide on the dashboard can really be used effectively or not.
Implementation guide:
- Training for each user group: reading – asking questions – how to take action based on data
- The organization running the test in 1-2 months: collect feedback, improved interface or index
- Integrated dashboard in the operations:
- Meeting weeks/months beginning with data from the dashboard
- KPI departments associated with data dashboard
- Warning from dashboard is the basis for a decision fast
Outputs of this step:
- Users understand, trust, active user dashboard
- Dashboard become a “strategic tool” instead of just table decor
4. Benefits of Financial Dashboard with business
Quick overview – see the big picture in few seconds
Financial Dashboard provides an overall view about the financial situation in just one screen: revenue, profit, cash Flow, debt, inventory, etc. No need to open each file, filtering each sheet — all the important indicators are displayed visually immediately upon opening the dashboard.
According to the survey of Dresner Advisory Services (2024), 67% of businesses said they make their decisions more quickly when using the dashboard financial intuitive.
Refer to: Nền tảng dữ liệu thông minh hỗ trợ ra quyết định chiến lược
Decisions quickly, the more accurate
Updated information in real time (real-time) allows for CEOS, CFOS no longer depends on the time reporting. With warning KPI (such as negative cash flow, debts and rising), the business can take action before the risk becomes a crisis.
Optimize cash flow, operating costs
Through financial indicators to be measured, compared periodically, business easily identify areas which are cost exceeds the threshold, or has liabilities lasted need to handle. Dashboard financial help optimize operated by decisions based on real data.
Increase transparency, the ability to monitor internal
Through decentralization, share dashboard according to departments, enterprises can:
- Financial management by branch or department
- Delivery KPI clear, transparent
- Effective tracking financial activities according to each group of products/services
Enhance governance & competitiveness
Any business owner information at the right time will make a decision fast more accurate. In the environment of fierce competition, Financial Dashboard is a strategic advantage to win dominance, financial, dominate the market.
5. Features required of a solution Dashboard professional
A dashboard financial efficiency not only the tables beautifully. To create real value for business solutions, Financial Dashboard should have these core features below:
Data connection accounting & ERP automatically
Dashboard must be connected directly with accounting software, ERP, or business data (such as AccNet CloudFast, SAP, Odoo...) to ensure:
- Automatic data updates daily
- Avoid the risk of errors due to input manually
- Financial data is always correct, complete
Reports real-time & drill-down flexibility
Solution should allow:
- View financial data in real time (real-time)
- Drill-down (dive) from the overview to each pen original payment
- Filter data by time, branches, departments, products
This helps the manager not only see the “problem” but also know where it came from.
Warning KPI indicator exceeds the threshold
Features smart alerts will help:
- Warning cash flow negative, debt maturity, the cost of which exceeds the ceiling...
- Set the threshold KPI fit each stage of commissioning
- Proactive decisions instead of reacting when it's too late
Intuitive interface & decentralized flexibility
- Display format chart, heatmap, gauge meter...
- Allows assignment of rights by role to ensure the manager sees only the data I was allowed to see
- Customize the dashboard according to the actual needs of each department
Financial forecasting, budgeting
A professional solution needs to support:
- Simulation of future cash flows
- Forecast revenue/profits seasonal, growth scenarios
- Support budgeting, compare budget with actual
6. Case Study: commercial Enterprise Dashboard app success
Business introduction
- Business name: Trade co., LTD Services, Equipment A. P. A
- Field of activity: distribution industrial electrical equipment – civil (Schneider, Panasonic, LS, etc.)
- Scale: medium Business, about 80 staff, there are 2 branches in Hanoi, ho chi minh CITY.CITY
System data before deployment dashboard:
- Accounting software left (only accounting use)
- Excel aggregate public debt, inventory
- Financial reporting late 7-10 days after the reporting period
- Debt management customers depends heavily on accounting
Issues before deploying Financial Dashboard
Before deploying dashboard financial, A. P. A meet many points of congestion in the executive:
Financial data dispersed, difficult to follow in real time
- The CEO can't see fast sales during the day, debt, inventory, fluctuations in cash flow
- The department operates the reason every where synthetic own way
Teen indicators, early warning, risk
- No early detection is overdue
- Inventory long day is “forget”, which led to obsolete, discount
Decisions based on feelings
- Plans to enter the restaurant, according to the experience, not based on data
- Cost increase but don't know increase where, at any time
Deployment process Financial Dashboard at A. P. A
Below is the step A. P. A made to convert efficiency:
Step 1: Define the objective & KPI core
- Target: CEO grasp the entire cash flow, revenue instant; control public debt & inventory tightly
- KPI selection include:
- Revenue by branch / staff / items
- Public debt over time, according to customer group
- Bien net profit of each product
- Inventory turnover
- Condition cash funds by date
Step 2: integrate & standardized data
- Connection data from the accounting software, excel file inventory, sales quotes
- Clean code, customer unit to ensure consistency
Step 3: design dashboard according to role
- CEO: Dashboard overview, financial, real-time
- Sales: track sales, orders, rate quota
- Chief accountant: Public debt, revenues and expenditures, inventory, cash flow analysis
Step 4: set up automatic alerts
- Warning the overdue > 15 days
- Inventory alert for slow-moving > 60 days
- Warning negative cash flow in the next 7 days
Step 5: Training & integrated in the process meeting the week
- The head of the department use the dashboard as a background for meeting internal
- Plan, order entry, billing, sales are based on the analysis of data dashboard
Results achieved after 6 months of deployment
| Index | Before deployment | After deployment |
| Duration synthesis report | 7-10 days | Almost instant (real-time) |
| The rate of overdue debt | 24% | 9% |
| Inventory on 90 days | 18% of the total survival | Reduced to 5% |
| Time out decided to enter the restaurant | 3-4 days | Only 1 meetings based on data |
| Revenue growth quarter after | — | +13% due to optimal inventory & liabilities |
Reason A. P. A successful deployment
- Don't hug too much index: select only 10 KPI's real strategy
- Deployment process seriously, have a leader (CEO directly involved)
- Delivery dashboard according to role specific – who, what to see, see where to
- Integrated dashboard on the actual operating – do not make “beautiful to see”
Lessons for the business commercial other
- No need to “switch of the” right, can start from mastering cash flow – revenue – public debt
- Let data driven decisions instead of emotional
- A Financial Dashboard that becomes the background for every meeting, every plan, not a tool for private accounting
Owning a Financial Dashboard professional no longer a choice, which is a mandatory requirement if the business wants to sustainable development. Not only help overview of the financial indicators dashboard, there are tools to help business decisions faster, reduce risk, increase operating speed.
If you are looking for a solution that is both powerful and easy to deploy, start from AccNet BI Dashboards – the platform is optimized for Vietnamese businesses to help connect data, financial – accounting, converting data into a competitive strength.
CONTACT INFORMATION:- ACCOUNTING SOLUTIONS COMPREHENSIVE ACCNET
- 🏢 Head office: 23 Nguyen Thi huynh, Ward 8, Phu Nhuan District, ho chi minh CITY.CITY
- ☎️ Hotline: 0901 555 063
- 📧 Email: accnet@lacviet.com.vn
- 🌐 Website: https://accnet.vn/
Theme: